Understanding Support and Resistance Levels in Index Charts

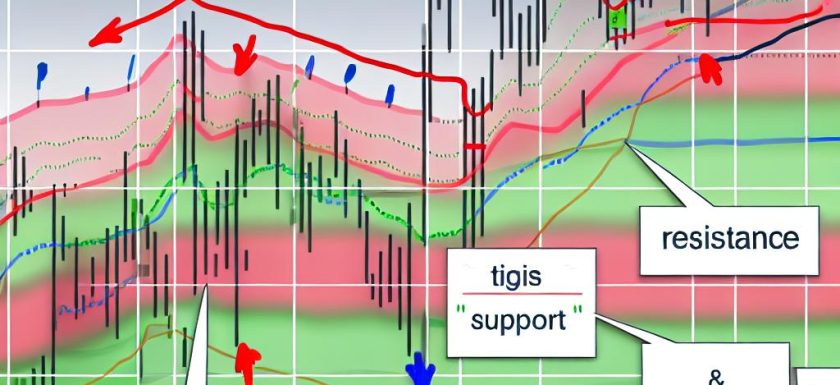
Introduction to Support and Resistance Understanding support and resistance levels is a fundamental aspect of technical analysis in trading. These concepts are widely applied to index charts and play a crucial role in determining potential market movements. Traders use these levels to make informed decisions about entry and exit points. Recognizing these patterns can be the difference between profitable trades and losses for both beginner and professional traders alike. Definition of Support and Resistance Levels Support is a price level where a downtrend can be expected to pause due to a concentration of buying interest. As the price drops towards support, buyers become more likelyRead More →

How to Use Technical Indicators for Index Trading

Understanding Technical Indicators Technical indicators serve as vital analytical tools within the realm of financial markets, specifically aiding traders in interpreting price movements and forecasting potential future price trends of financial instruments like index funds. Derived from historical price data, these indicators are integrated into chart patterns and offer traders invaluable insights to make informed trading decisions. However, it is important to note that these indicators should not be relied upon in isolation. Instead, they function optimally when incorporated into a comprehensive trading strategy that accounts for various market elements and conditions. Types of Technical Indicators Technical indicators are broadly categorized into distinct types, eachRead More →