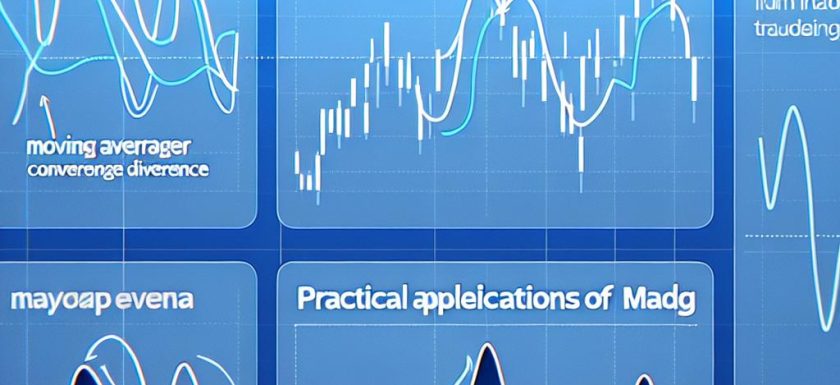
Understanding MACD in Index Trading
The Moving Average Convergence Divergence (MACD) is a prominent technical indicator extensively utilized by traders and analysts across various financial markets, including index trading. Originating in the late 1970s, courtesy of its developer Gerald Appel, MACD aids in identifying changes in the strength, direction, momentum, and duration of a trend observed in a stock’s price. Through understanding and applying MACD, traders can potentially gain insights into market behaviors and better navigate the complexities of index trading.
Components of MACD
A comprehensive grasp of MACD necessitates an understanding of its foundational components, each contributing distinctively to its functionality. These components encapsulate:
1. The MACD Line: This element is engineered by subtracting the 26-period Exponential Moving Average (EMA) from the 12-period EMA of the asset’s price. The MACD line serves as the core element, providing the primary cues regarding potential shifts in market trends and momentum.
2. The Signal Line: Represented by a 9-period EMA of the MACD line, the Signal Line is adept at functioning as a trigger for both buy and sell signals. This component serves a pivotal role in helping traders discern entry and exit points in the market with enhanced accuracy.
3. The Histogram: It represents the differential between the MACD line and the Signal line. By providing a visual depiction of the market’s momentum, it helps traders quickly ascertain shifts, allowing them to react more promptly to market changes.
Interpreting MACD
As both a momentum and trend-following indicator, MACD’s signals can be deciphered through various approaches:
Crossover: The behavior of the MACD line in relation to the Signal line is significant in providing trading cues. When the MACD line transcends the Signal line, this movement is suggestive of a potential buying opportunity. Conversely, when the MACD line crosses beneath the Signal line, it could indicate a potential selling position, signaling to traders that a market shift might be on the horizon.
Divergence: Divergence emerges when the price movement of an index and the MACD indicator demonstrate contrary directions. A bullish divergence arises when prices are declining, yet the MACD exhibits an upward trajectory, potentially forewarning a reversal in market trends. On the flip side, a bearish divergence depicts the opposite scenario, with rising prices and a falling MACD, indicating a possible downward reversal.
Zero Line Cross: Another critical aspect of MACD is the crossing of the zero line, which provides clues about market trends. When the MACD line traverses above the zero line, it may signify the inauguration of an upward trend. Conversely, moving below zero could imply the commencement of a possible downtrend.
Applying MACD in Index Trading
In the realm of index trading, leveraging MACD can offer traders valuable perspectives into potential market directions. The broad nature of indexes, which often reflect broader economic conditions, necessitates an astute incorporation of macroeconomic factors when utilizing MACD for index analysis.
Traders engaging in index trading might benefit from adjusting the parameters of the EMAs in the MACD calculation. Tailoring the sensitivity of the indicator to correspond with the specific index being traded can heighten the accuracy and effectiveness of MACD in evaluating market dynamics. This adaptability is integral in ensuring the MACD aligns with the unique characteristics inherent in different indexes.
Limitations of MACD
Despite the formidable capabilities of MACD, recognizing its limitations is paramount in forming a balanced perspective on its application. Primarily a lagging indicator, MACD demonstrates heightened efficacy in trending markets rather than sideways ones. In scenarios where markets exhibit lateral movement, MACD may falter in precisely predicting future price actions.
For traders, it is advisable to employ MACD in tandem with other indicators and analytical techniques to reinforce their market assessments. By doing so, they enhance their comprehension of the market’s multifaceted nature and foster more informed decision-making processes.
While MACD holds the potential to significantly improve trading strategies, applying its insights demands caution and an awareness of the broader trading ecosystem. Traders who adopt a holistic approach, factoring in additional indicators and analytical methods, are better positioned to navigate the intricacies of market fluctuations. MACD serves as one tool in a trader’s toolkit, complementing other strategies and enhancing trading efficacy.
Incorporating MACD into trading strategies requires a meticulous approach, acknowledging the lagging nature of the indicator while leveraging its strengths to capture momentum and trend shifts effectively. By coupling MACD with a robust analytical framework, traders can enhance their decision-making prowess, potentially achieving more favorable outcomes in their trading endeavors.
This article was last updated on: April 20, 2025