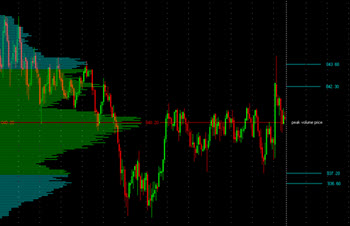
Volume based technical analysis, also known as volume analytics, is based on the idea that volume and index behaviors are interrelated, and that patterns in volume can be used to accurately spot trading patterns of an index.
 It is rare for traders to rely in volume analytics alone – it is a method commonly employed together with other methods, both from the fields of technical analysis and from other areas of the market forecasting business. For many long-term successful traders, volume analytics is an important piece of the puzzle rather than a stand-alone prediction tool.
Volume patterns include a lot of interesting information but it can be difficult to know what to look for and how to interpret seemingly contradictory signs. Today, volume data is available on an unprecedented scale, even for the individual hobby trader. With a minimal lag, we can follow what’s going on at the markets in terms of volume.
Volume analytics is applied to indexes and similar rather than individual stocks (or other financial instruments) because a mixed bag is more likely to reflect the overall mood of the market or a specific segment of the market. Financial instruments have a tendency to move in accordance with the overall market or market segment, which is why traders who are able to spot broad trends can reap huge profits even if they aren’t interested in buying and selling a complete index-based asset portfolio or speculate in index-tracking fund shares.
One of the most valuable aspects of volume analysis is its ability to give us a reality check when we have stared for too long at highly specific signals or dwelt to long upon the characteristics of a specific stock company. Volume analysis will help us see what’s really going on in the markets.
This article was last updated on: August 28, 2016
