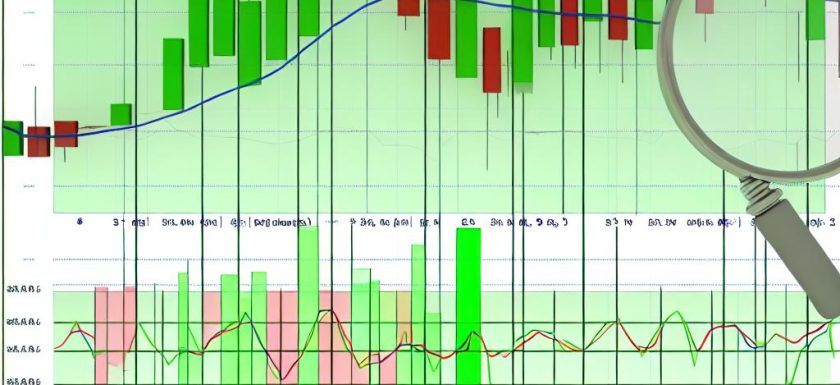
Understanding Moving Averages
Moving averages are statistical tools widely utilized in the field of technical analysis. They are instrumental in offering a clearer picture of price data by maintaining a constantly updated average price. Such methods are particularly beneficial when working with indices. Traders and analysts often employ moving averages to discern market trends, identify potential buy or sell signals, and interpret market behavior over specific time frames.
The Concept of Moving Averages
The main principle behind moving averages is their ability to filter out the “noise” that stems from random short-term market fluctuations, thereby emphasizing the true direction of a trend. This functionality is what makes them so apt for index technical analysis. By focusing on the underlying market movements rather than transient market ‘noise,’ moving averages provide a more structured view of market trends. Two primary types of moving averages that analysts utilize are the Simple Moving Averages (SMA) and the Exponential Moving Averages (EMA).
Simple Moving Average (SMA)
The Simple Moving Average (SMA) is a straightforward calculation where the sum of a given set of values is divided by the number of values to produce an average. For instance, a 10-day SMA of an index involves summing up the index’s closing prices over the last ten days, followed by dividing the total by ten. The simplicity of SMAs lies in their ability to provide a general picture of market trends, often serving as a basic tool for analysts seeking to understand longer-term trend directions.
Exponential Moving Average (EMA)
In contrast, the Exponential Moving Average (EMA) assigns more significance to more recent price points, which in turn makes it more sensitive to the latest market data. This version of the moving average adapts quicker to any changes in price, which makes it a favorable choice for traders who wish to react swiftly to market events. Due to this bias towards more recent price action, EMAs are deemed particularly suitable for analyzing fast-paced market changes, providing more timely insights compared to their SMA counterparts.
Application in Index Technical Analysis
Moving averages find extensive application in index technical analysis, especially when it comes to identifying trend directions. A common interpretation is that when an index is trading above its moving average, it indicates a bullish signal, whereas trading below the moving average might suggest a bearish trend. These insights are valuable to traders, guiding them in their decision-making process regarding entry and exit points in trades.
Using Moving Averages as a Baseline
Often, moving averages serve as a baseline for comparison against other indices or stocks. If, for example, an index moves below its moving average while another index stays above, it might suggest a perceived relative weakness in the former. Such movements can hint at shifts in market dynamics and offer crucial insights into how trends are evolving, helping traders and analysts refine their strategies and positions.
Crossovers as Trading Signals
Crossovers are another primary feature of moving averages that traders monitor closely. A bullish crossover is characterized by a shorter-term moving average crossing above a longer-term moving average, which may signal increasing upward momentum. Conversely, a bearish crossover manifests when a shorter-term moving average dips below a longer-term moving average, heralding a possible downward trend. These crossovers are integral to many trading strategies and remain a focal point in the technical analysis of market indices.
Advantages and Considerations
While moving averages offer significant advantages in tracking price trends and potential market shifts, they also come with certain limitations. Being lagging indicators, moving averages rely on historical data, which means they might not reflect the latest market changes promptly. Consequently, traders are advised to leverage moving averages in conjunction with other analytical tools to bolster precision and minimize risk. Examples include pairing moving averages with indicators such as the Relative Strength Index (RSI) or Moving Average Convergence Divergence (MACD) to create a more holistic analysis framework.
Conclusion
In summary, moving averages remain a fundamental aspect of index technical analysis. By smoothing out price data, they empower analysts and traders with the ability to better comprehend market trends and make informed decisions in trading scenarios. Despite the substantial benefits offered by moving averages, relying on them exclusively may not provide a comprehensive overview of market dynamics. Instead, to achieve a more complete analysis, they should be incorporated into a broader strategy comprising several technical indicators. In this way, traders and analysts can create a more rounded approach to understanding and predicting market activities.
This article was last updated on: March 23, 2025
