Introduction to Candlestick Patterns in Stock Indices
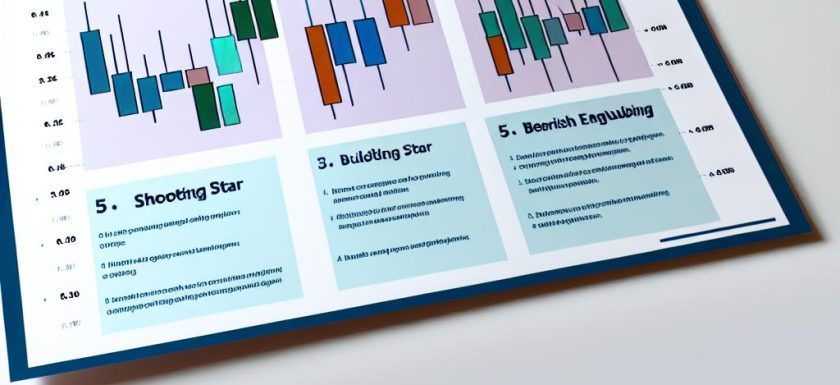
Candlestick patterns are essential tools for traders analyzing stock indices. These patterns provide visual cues about market sentiment and potential future movements in the prices of indices like the S&P 500, Nasdaq, and Dow Jones. In this article, we will explore the top five candlestick patterns that are commonly used by traders in assessing stock indices.
1. Bullish Engulfing Pattern
The bullish engulfing pattern occurs when a small bearish candle is followed by a larger bullish candle, completely engulfing the previous day’s body. This pattern suggests that the bulls have overtaken the bears, indicating potential upward momentum. Traders often interpret this pattern as a signal to consider long positions.
For technical analysts, the bullish engulfing pattern is vital because it encompasses two distinct market days, conveying a change in investor sentiment over a short period. The pattern often appears at the conclusion of a downtrend, signaling a possible turning point. The critical aspect of the pattern is the size and scope of the bullish candle, which should not only be larger than the bearish candle but also indicate significant buying pressure.
2. Bearish Engulfing Pattern
Conversely, a bearish engulfing pattern is identified when a small bullish candle is followed by a larger bearish candle. In this pattern, the bearish candle fully engulfs the previous candle’s body. It suggests a shift in market sentiment from bullish to bearish, which could precede a price decline. Traders may use this as a cue to consider short positions.
Much like its bullish counterpart, the bearish engulfing pattern takes a two-day formation. Appearing after an uptrend, it implies that sellers have regained control, potentially leading to further price decreases. This pattern is considered a significant reversal signal, especially when accompanied by high trading volumes, which indicates strength and conviction behind the move.
3. Doji Candlestick
A doji candlestick represents indecision in the market. Characterized by a very small body where the open and close prices are almost the same, the doji suggests that buying and selling pressures are balanced. While it does not directly indicate a trend change, it can signal a potential reversal if it appears at the top or bottom of a trend. The appearance of a doji warrants attention and possibly further verification from other indicators.
The doji candlestick is a unique indicator due to its neutrality; it lacks a definitive directional signal. However, when traders spot a doji, they often assess the prevailing market conditions and other technical factors to make informed decisions. A doji occurring amidst a strong trend can imply a weakening momentum, encouraging traders to closely examine subsequent market behavior for potential trend reversals.
4. Hammer and Hanging Man
The hammer and hanging man are single-candle patterns that have similar appearances but different implications based on their location in a trend.
Hammer: Found at the bottom of downtrends, the hammer indicates a potential reversal to the upside, characterized by a small body with a long lower wick. The long wick suggests a rejection of lower prices, where buyers step in to push the price higher by the close.
Hanging Man: Located at the top of uptrends, it suggests a possible reversal to the downside, sharing the same appearance as the hammer. The presence of a hanging man can imply that the market could be losing its upward momentum, as sellers begin to gain ground.
Both of these patterns relay key information about resistance and support levels in the market, inviting traders to evaluate these levels as potential areas of reversal.
5. Morning and Evening Star
The morning star and evening star are three-candlestick patterns that signal trend reversals.
Morning Star: This bullish reversal pattern appears at the end of a downtrend. It consists of a large bearish candle, followed by a small-bodied candle indicating indecision, and finally a large bullish candle indicating the start of an uptrend. The formation illustrates a shift in market sentiment as initially bearish conditions make way for bullish resurgence.
Evening Star: This pattern is the bearish counterpart, occurring at the peak of an uptrend and suggesting a reversal to the downside. The evening star consists of a large bullish candle, a small-bodied candle indicating market indecision, and a final sizable bearish candle signifying the move towards a downtrend.
These patterns are highly regarded due to their reliable signals of trend reversals, particularly when supported by volume analysis or other confirmation indicators.
Conclusion
Understanding candlestick patterns is crucial for trading stock indices. Each pattern provides insight into market sentiment and potential future trends. By analyzing these patterns within the context of broader market trends and using them alongside other technical analysis tools, traders can refine their strategies. Candlestick patterns such as the bullish and bearish engulfing, doji, hammer and hanging man, as well as the morning and evening star, are valuable for making informed trading decisions. For further in-depth knowledge, traders can access more resources online or consult trading platforms that provide comprehensive tutorials and examples of these patterns in action.
The complexities of financial markets necessitate not just a surface understanding of these patterns but also an awareness of how they fit into the larger technical analysis framework. Traders benefit significantly by integrating these candlestick patterns into their overall trading strategies, considering both historical data and predictive analytics, to maximize their potential for successful trades. Overall, the disciplined application of candlestick analysis can serve as a potent complement to the multifaceted approach needed in effective stock indices trading.
This article was last updated on: March 30, 2025
