Introduction to Support and Resistance
Understanding support and resistance levels is a fundamental aspect of technical analysis in trading. These concepts are widely applied to index charts and play a crucial role in determining potential market movements. Traders use these levels to make informed decisions about entry and exit points. Recognizing these patterns can be the difference between profitable trades and losses for both beginner and professional traders alike.
Definition of Support and Resistance Levels
Support is a price level where a downtrend can be expected to pause due to a concentration of buying interest. As the price drops towards support, buyers become more likely to buy, and sellers become less likely to sell, causing the price to bounce back. Essentially, support acts as a floor, preventing the price from declining further.
Resistance, on the other hand, is the opposite, where an uptrend may pause due to a strong concentration of selling interest. At this level, as the price rises towards resistance, sellers become more likely to sell, and buyers become less inclined to buy, potentially leading to a price decline. Resistance acts as a ceiling that the price struggles to break.
How Support and Resistance Levels Form
Support and resistance levels often form based on psychological price points like round numbers. These are prices that are perceived to be more significant by market participants. Additionally, previous lows can become support because buyers remember these levels as areas where prices have tended to rise in the past. Conversely, previous highs can serve as resistance, as these are levels where prices have historically tended to fall.
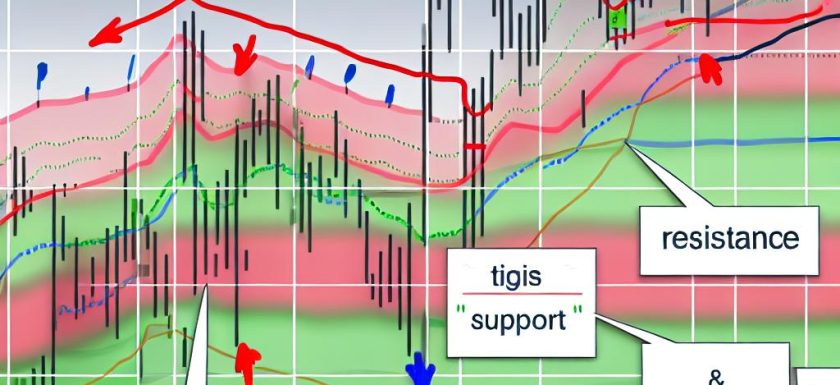
Aside from these static levels, moving averages and trendlines may also act as dynamic support and resistance levels. As these averages change with each new price point, they offer moving targets for price action as opposed to static levels.
The Role of Volume
Volume plays an integral role when examining these levels. A support level accompanied by increased volume indicates strong buying pressure, enhancing the likelihood of a sustained bounce. Likewise, resistance levels with high volume suggest substantial selling pressure, potentially preventing further price increases. This interaction between volume and price levels can affirm the strength of support or resistance, thus providing a more nuanced approach to technical analysis.
Identifying Support and Resistance on Index Charts
To effectively identify support and resistance on index charts, traders commonly use long-term and short-term perspectives. This process often involves analyzing the historical price data of an index and pinpointing areas where prices have consistently struggled to move above or below.
Using Trendlines
One effective method for identifying support and resistance is through the use of trendlines. By connecting a series of rising lows, traders can create an ascending trendline which may act as support. The upward inclination of the line suggests that buyers are stepping in at higher prices over time. Conversely, connecting a series of declining highs creates a descending trendline, which can serve as resistance. Here, the downward direction points to sellers coming in at lower price points, highlighting a potential area of selling pressure that buyers may struggle to overcome.
Applying Moving Averages
Moving averages are frequently used to assess support and resistance due to their ability to smooth out price data over a specified period. A common approach is to apply longer-period moving averages like the 50-day or 200-day moving averages. These serve as significant support or resistance, hinting at the general sentiment and momentum of the market. For instance, when a security’s price is above its moving average, it may indicate an uptrend, with the moving average acting as a support level. Conversely, if the price is below, the moving average could function as resistance, suggesting a potential downtrend.
For those interested in a deeper understanding of moving averages, more information can be found by visiting this resource.
Utilizing Technical Indicators
To augment the identification of support and resistance levels, traders also employ a range of technical indicators. Indicators like the Relative Strength Index (RSI), Bollinger Bands, and Fibonacci retracement levels are often used to confirm these areas. For example, when RSI hits an overbought level while a stock approaches resistance, it may reinforce the likelihood that the price will retreat. Meanwhile, Bollinger Bands can visually express periods of high volatility that coincide with breakouts or reversals at support and resistance.
Conclusion
Mastering the use of support and resistance levels can provide traders with a greater understanding of market dynamics and potential turning points on index charts. While these concepts are relatively straightforward, it is important to note that they are only part of the broader picture in technical analysis. Support and resistance should not be analyzed in isolation; instead, they ought to be combined with other tools and strategies for a comprehensive analysis. This cannot be overemphasized, as market behavior is influenced by numerous factors, and decisions should be made using a holistic approach.
Beyond analyzing charts, one must remain vigilant and continuously educate oneself on market trends and new strategies. Trustworthy and informative sources such as this tutorial provide valuable insights that help traders stay informed and adapt to changing market conditions.
Disclaimer
This content is for informational purposes only and should not be considered financial advice. Always conduct your own research or consult with a qualified financial advisor before making investment decisions. Markets are inherently uncertain, and risks are involved in trading, therefore it is crucial to verify the data and trends independently.
This article was last updated on: March 9, 2025